An ETL (Extract, Transform, and Load) pipeline is an essential data engineering process that extracts raw data from sources, transforms it into a clean, usable format, and loads it into a target storage system for analysis. For large-scale data processing, PySpark—with its distributed computing capabilities—is a robust choice. In this guide, we’ll walk through building an ETL pipeline using PySpark, leveraging its ability to process structured and unstructured data efficiently.
Dataset Overview
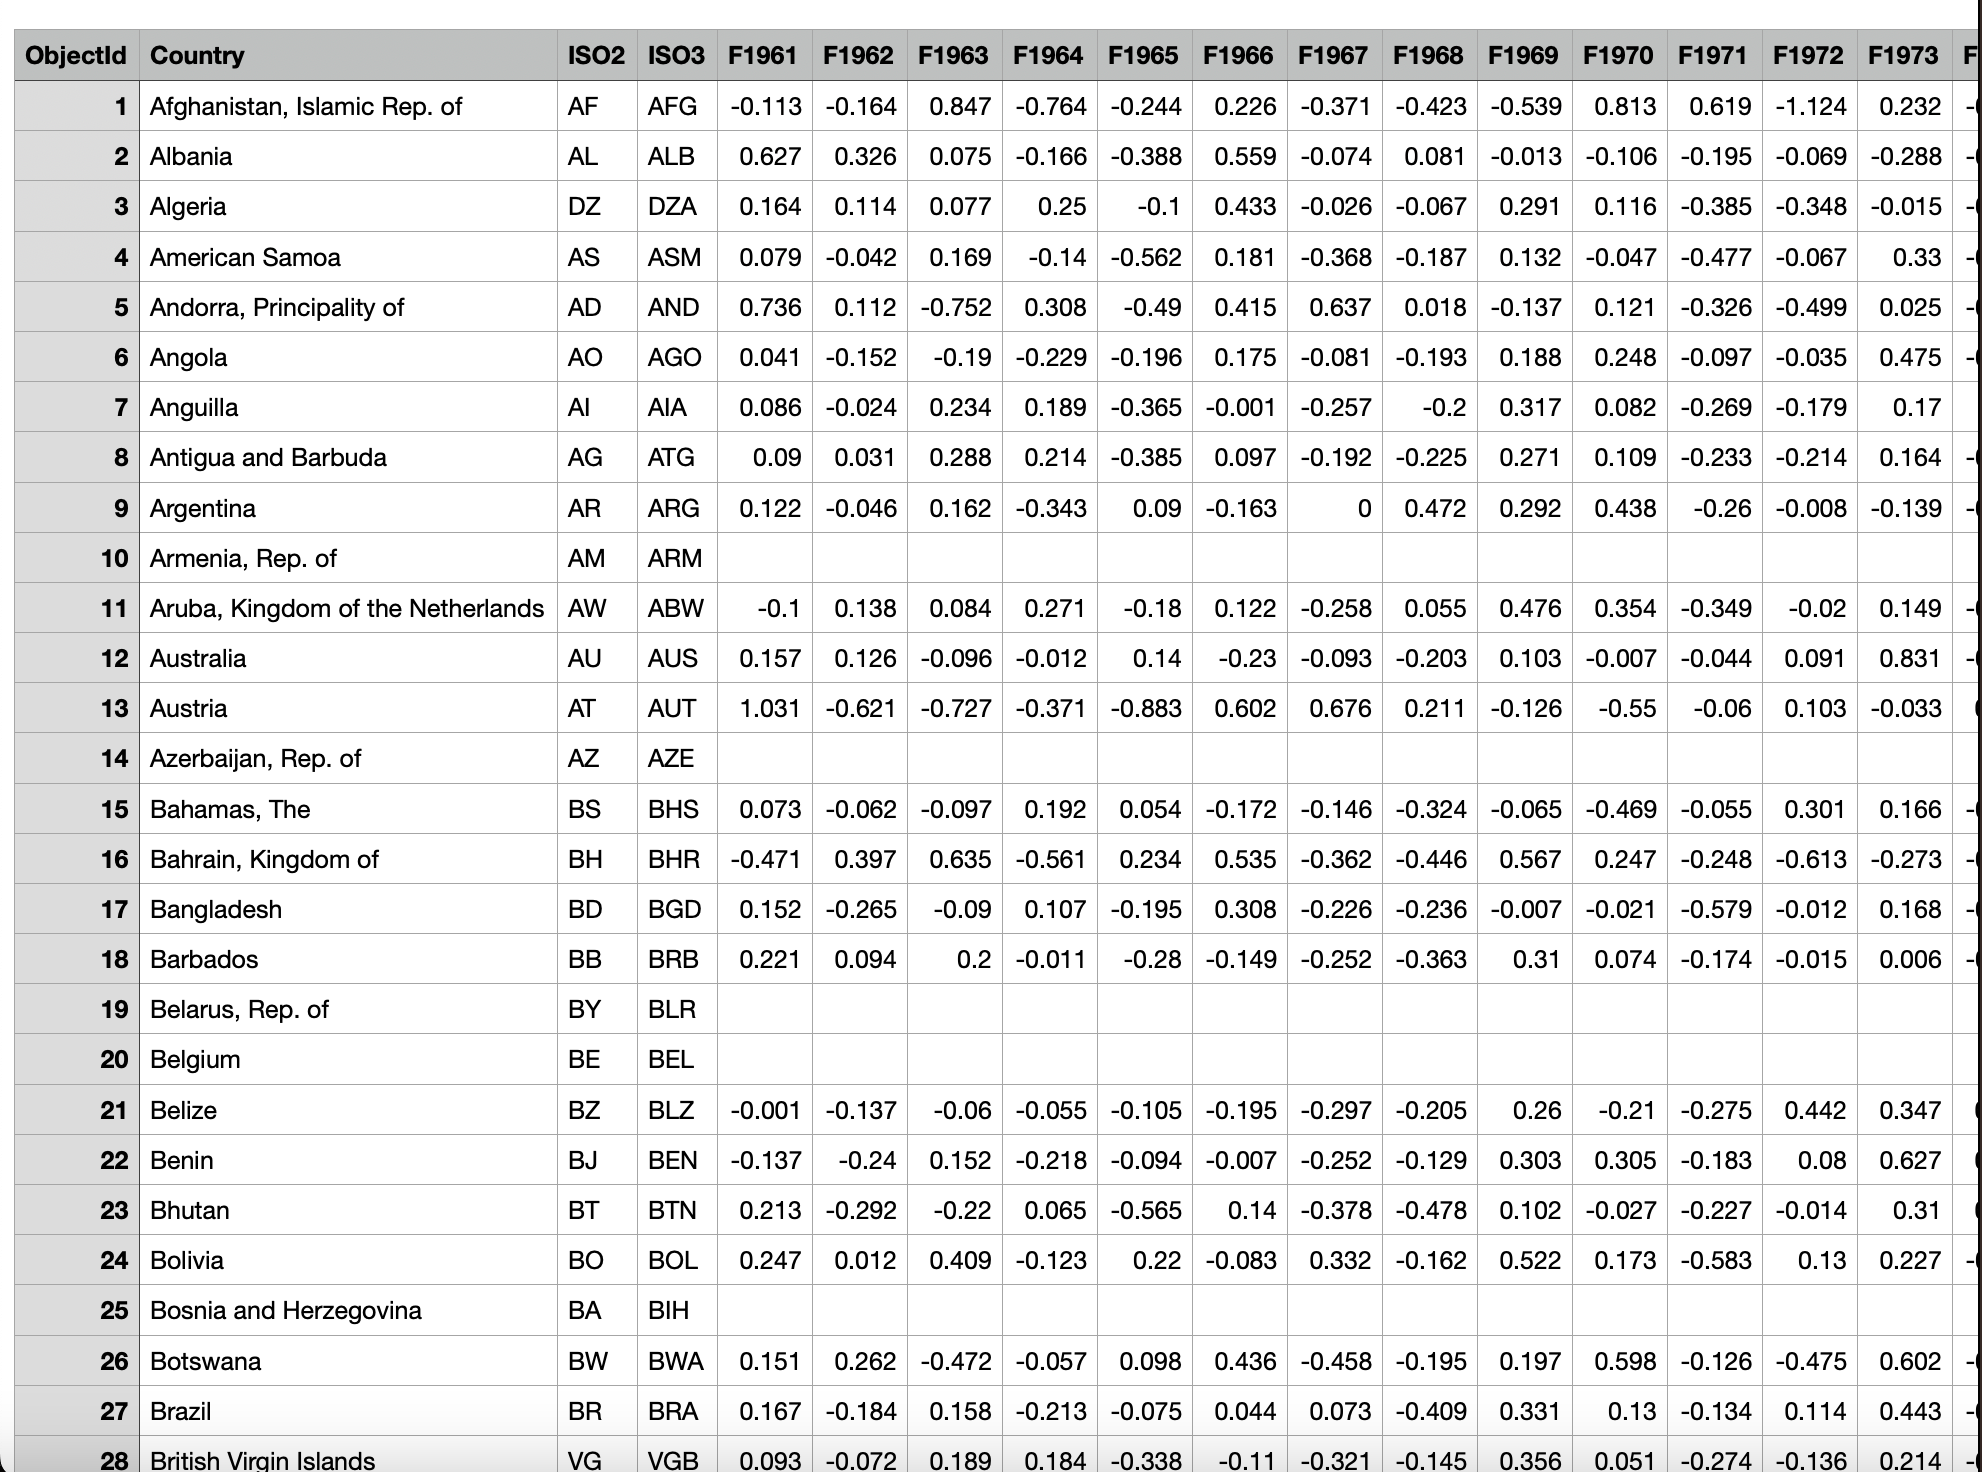
We’ll use a dataset containing temperature data for various countries spanning 1961 to 2022. The dataset includes:
- Identifiers:
ObjectId,Country,ISO2,ISO3 - Year-wise temperature data: Columns such as
F1961,F1962, etc., with floating-point values.
This dataset has missing values that need to be handled during transformation. You can download the dataset here.

ETL Pipeline Workflow
Our pipeline will follow three main steps:
- Extract: Load the data from a CSV file.
- Transform: Clean the data, handle missing values, and reshape it for analysis.
- Load: Save the processed data in optimized storage formats.
Step 1: Setting Up the Environment
First, ensure PySpark is installed. If not, install it using:
# pip install pyspark
Next, initialize a PySpark session:
from pyspark.sql import SparkSession
spark = SparkSession.builder \
              .appName("ETL Pipeline") \
              .getOrCreate()

This sets up a Spark session, allowing interaction with the Spark framework.
Step 2: Extract – Load the Dataset
Load the dataset into a PySpark DataFrame:
file_path = "content/temperature.csv"
df = spark.read.csv(file_path, header=True, inferSchema=True)

# Display the schema and preview the data
print("Schema:")
df.printSchema()
print("Preview:")
df.show(5)
PySpark handles distributed data processing, enabling seamless work on large datasets. The printSchema() method reveals the data structure, while show() offers a quick preview.
Step 3: Transform – Clean and Process the Data
Data transformation is crucial for preparing the dataset. Let’s clean the data and reshape it.
Handling Missing Values
Replace missing values in critical columns and drop rows with all temperature values missing:
from pyspark.sql.functions import col

# Fill missing country codes
df = df.fillna({"ISO2": "Unknown"})

# Identify temperature columns
temperature_columns = [c for c in df.columns if c.startswith('F')]

# Drop rows where all temperature columns are null
df = df.dropna(subset=temperature_columns, how="all")
Reshape Temperature Data
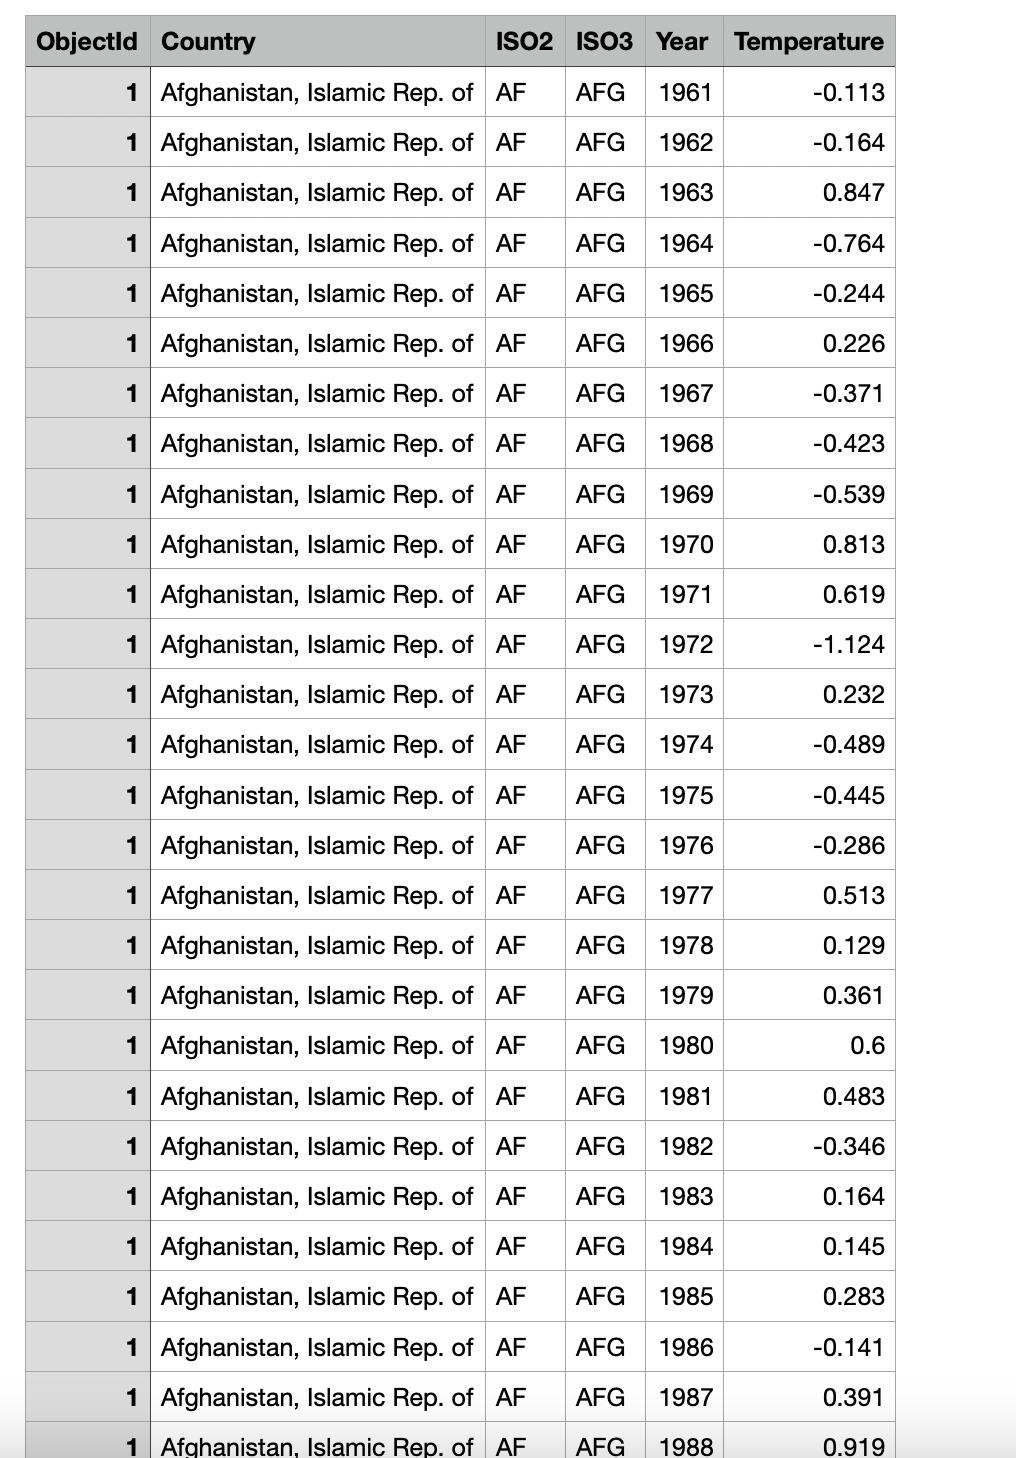
Reshape the year-wise temperature columns into two columns: Year and Temperature:
from pyspark.sql.functions import expr
# Pivot the data
df_pivot = df.selectExpr(
"ObjectId", "Country", "ISO2", "ISO3",
"stack(62, " +
",".join([f"'F{1961 + i}', F{1961 + i}" for i in range(62)]) +
") as (Year, Temperature)"
)

# Convert 'Year' column to integer
df_pivot = df_pivot.withColumn("Year", expr("int(substring(Year, 2, 4))"))
df_pivot.show(5)
This step restructures the dataset for easier analysis by converting multiple year columns into rows with corresponding Year and Temperature values.
Step 4: Load – Save the Processed Data
Save the transformed data for downstream analysis:
Save as Parquet
output_parquet_path = "content/generated/processed_temperature.parquet"
df_pivot.write.mode("overwrite").parquet(output_parquet_path)

# Verify the saved data
processed_df = spark.read.parquet(output_parquet_path)
processed_df.show(5)
Save as CSV:
output_csv_path = "content/generated/temperature_updated.csv"
df_pivot.write.mode("overwrite") \
.option("header", True) \
.csv(output_csv_path)

print(f"Data saved as CSV to: {output_csv_path}")
Summary:
In this guide, we built a complete ETL pipeline using PySpark:
- Extracted data from a CSV file into a distributed DataFrame.
- Transformed the data by handling missing values and reshaping the temperature data.
- Loaded the processed data into efficient storage formats (Parquet and CSV).
PySpark’s scalability and high performance make it an excellent choice for building ETL pipelines on large datasets. Feel free to ask questions or share feedback in the comments section below!
Code can found: https://github.com/arzerin/machine-learning/blob/main/data-science/etl.py


There are 0 comments