

Training a machine learning model is not only about achieving high accuracy. A model can reach 99% training accuracy and still perform badly on new data.
To evaluate a model professionally, you need to understand the relationship between:
- Training accuracy
- Validation accuracy
- Training loss
- Validation loss
- Test accuracy
These metrics help determine whether the model is underfitting, overfitting, or generalizing properly.
What Is Model Fitting?
Model fitting describes how well a machine learning model learns patterns from training data and applies those patterns to unseen data.
There are three main fitting conditions:
- Underfitting
- Good fitting
- Overfitting
The goal is to build a model that learns enough from the training data without memorizing it.
1. What Is Underfitting?
Underfitting occurs when a model is too simple or has not learned enough from the training data.
The model performs poorly on both the training data and validation data.
Typical Underfitting Graph
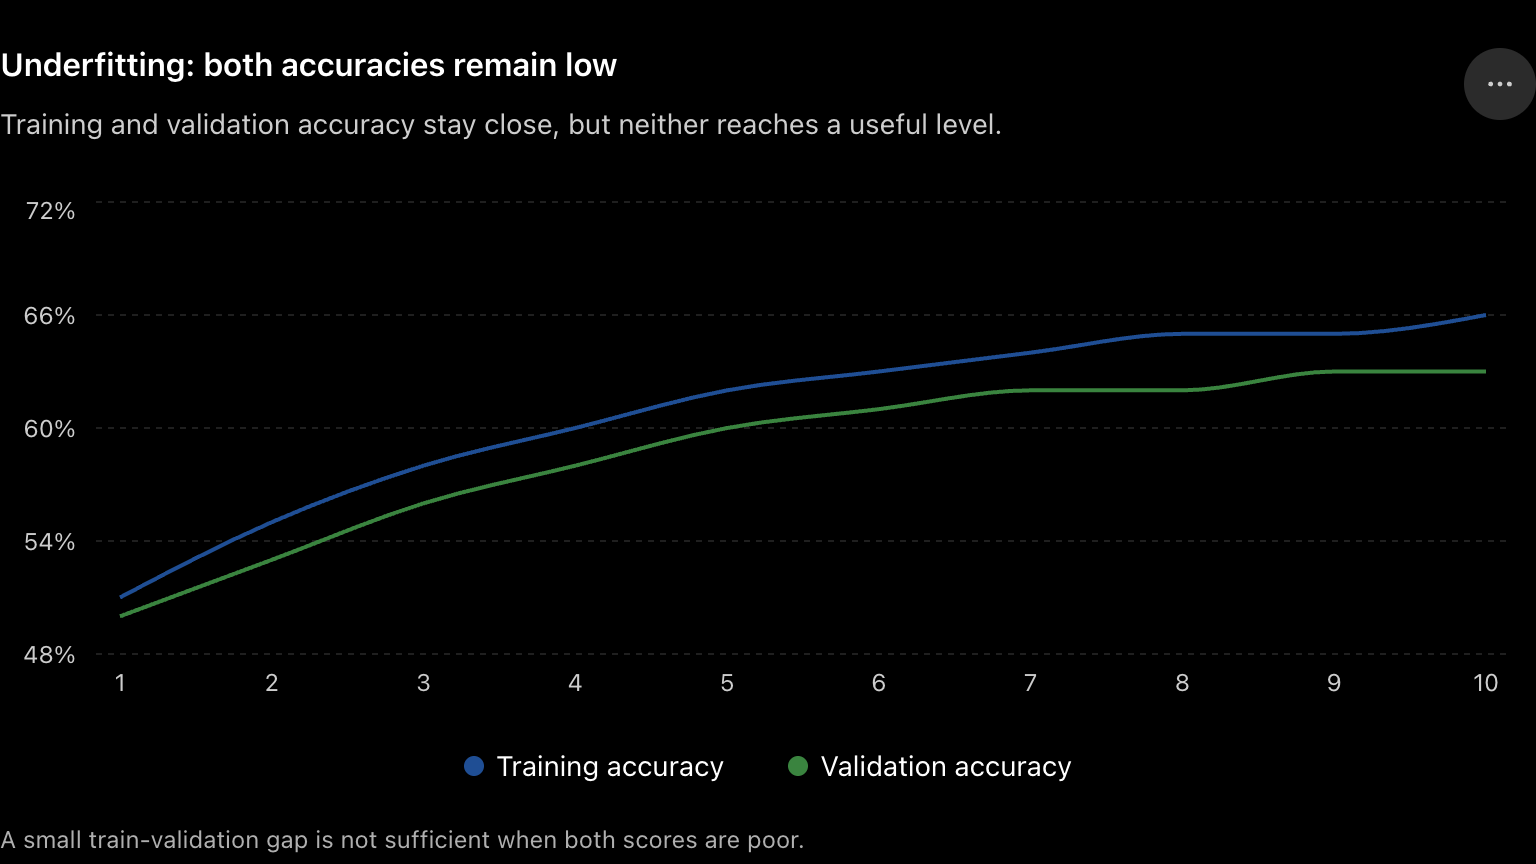
In an underfitting accuracy graph:
- Training accuracy remains low.
- Validation accuracy also remains low.
- The two curves may remain close together.
- Accuracy stops improving early.
Example:
Training accuracy:   66%
Validation accuracy: 63%
A small gap between training and validation accuracy does not always mean the model is good. If both values are low, the model is probably underfitting.
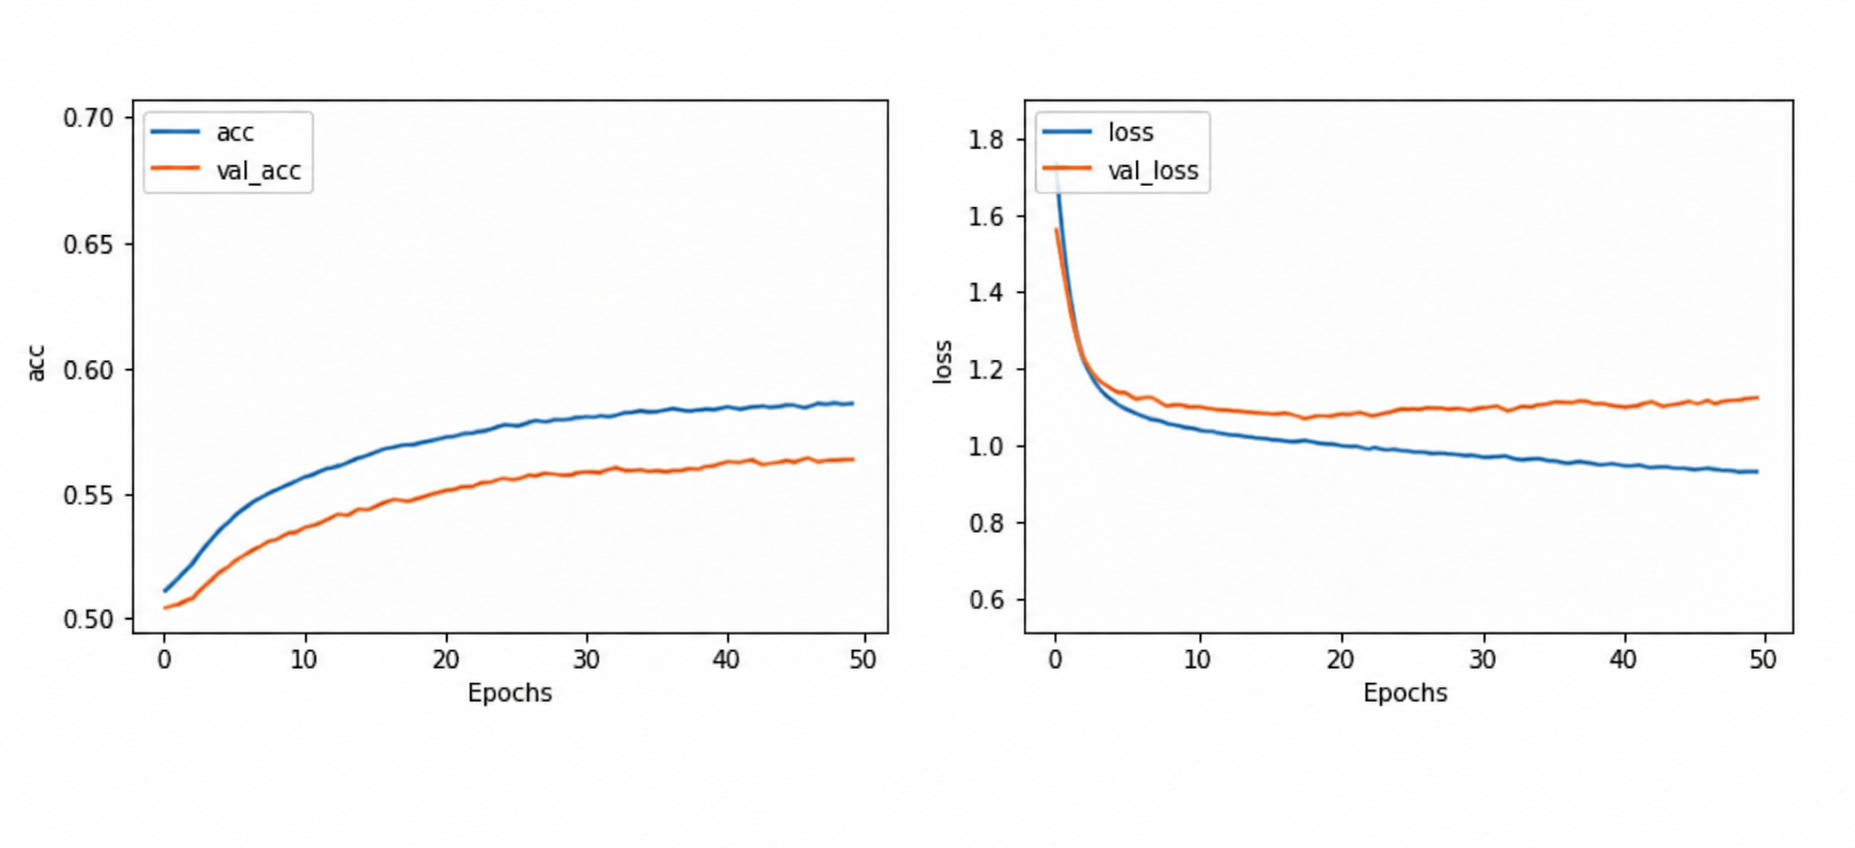
Underfitting Loss Pattern
In the loss graph:
- Training loss remains high.
- Validation loss also remains high.
- Both losses may decrease slowly.
- The curves may reach a plateau too early.
Common Causes of Underfitting
Underfitting may happen because:
- The model is too simple.
- The model has too few layers or neurons.
- The model was trained for too few epochs.
- The learning rate is unsuitable.
- Important features are missing.
- Data preprocessing is incorrect.
- Regularization is too strong.
How to Fix Underfitting
Possible solutions include:
- Increase model complexity.
- Add more layers or neurons.
- Train for more epochs.
- Improve feature engineering.
- Reduce excessive dropout or regularization.
- Use a more suitable optimizer.
- Adjust the learning rate.
- Improve data preprocessing.
2. What Is Overfitting?
Overfitting occurs when a model learns the training data too closely, including noise and unimportant details.
The model performs extremely well on training data but poorly on unseen validation or test data.
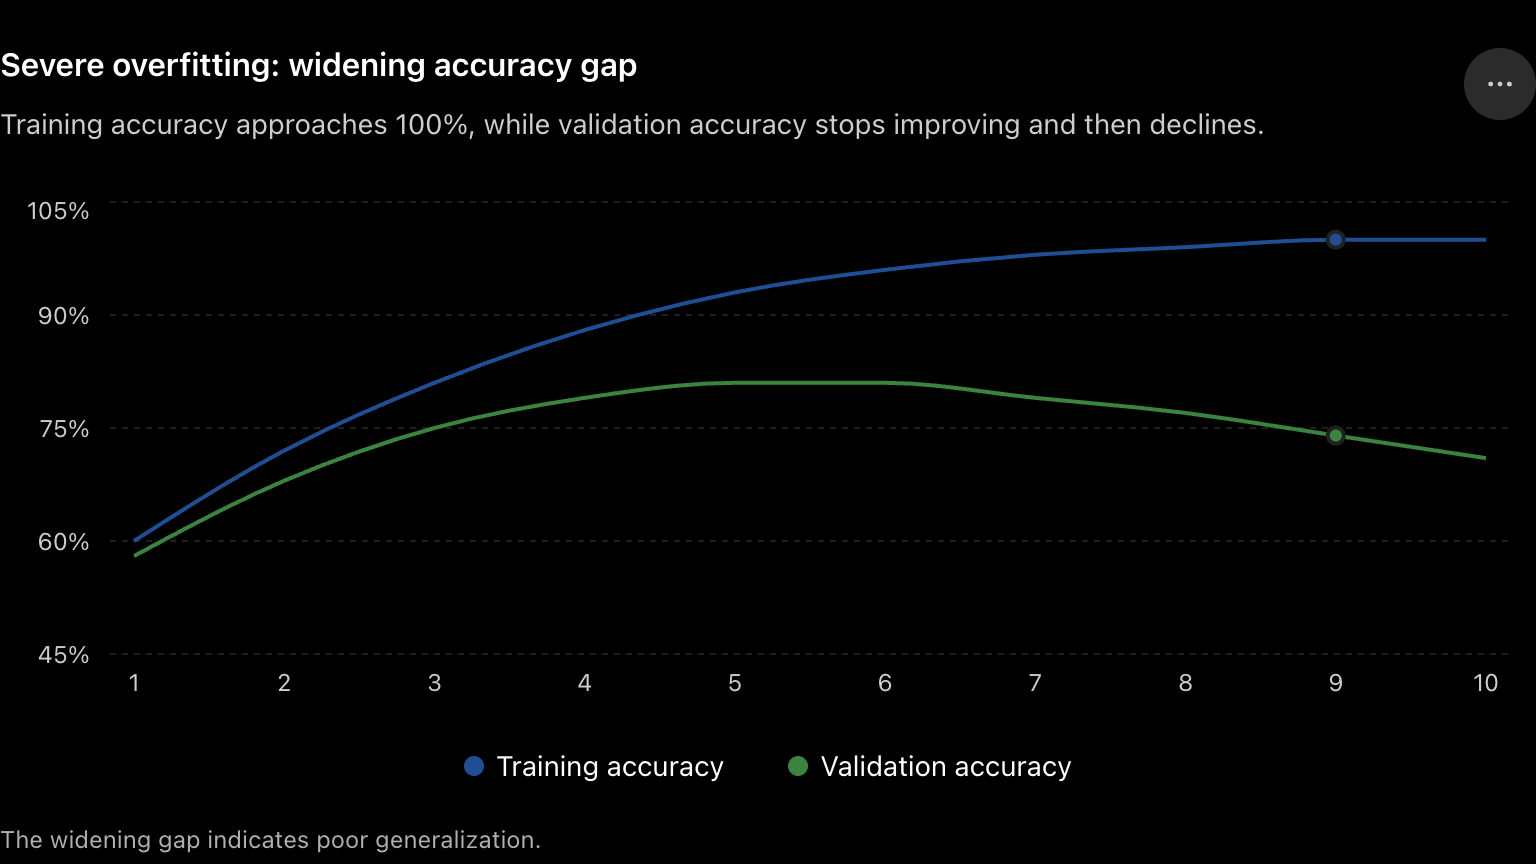
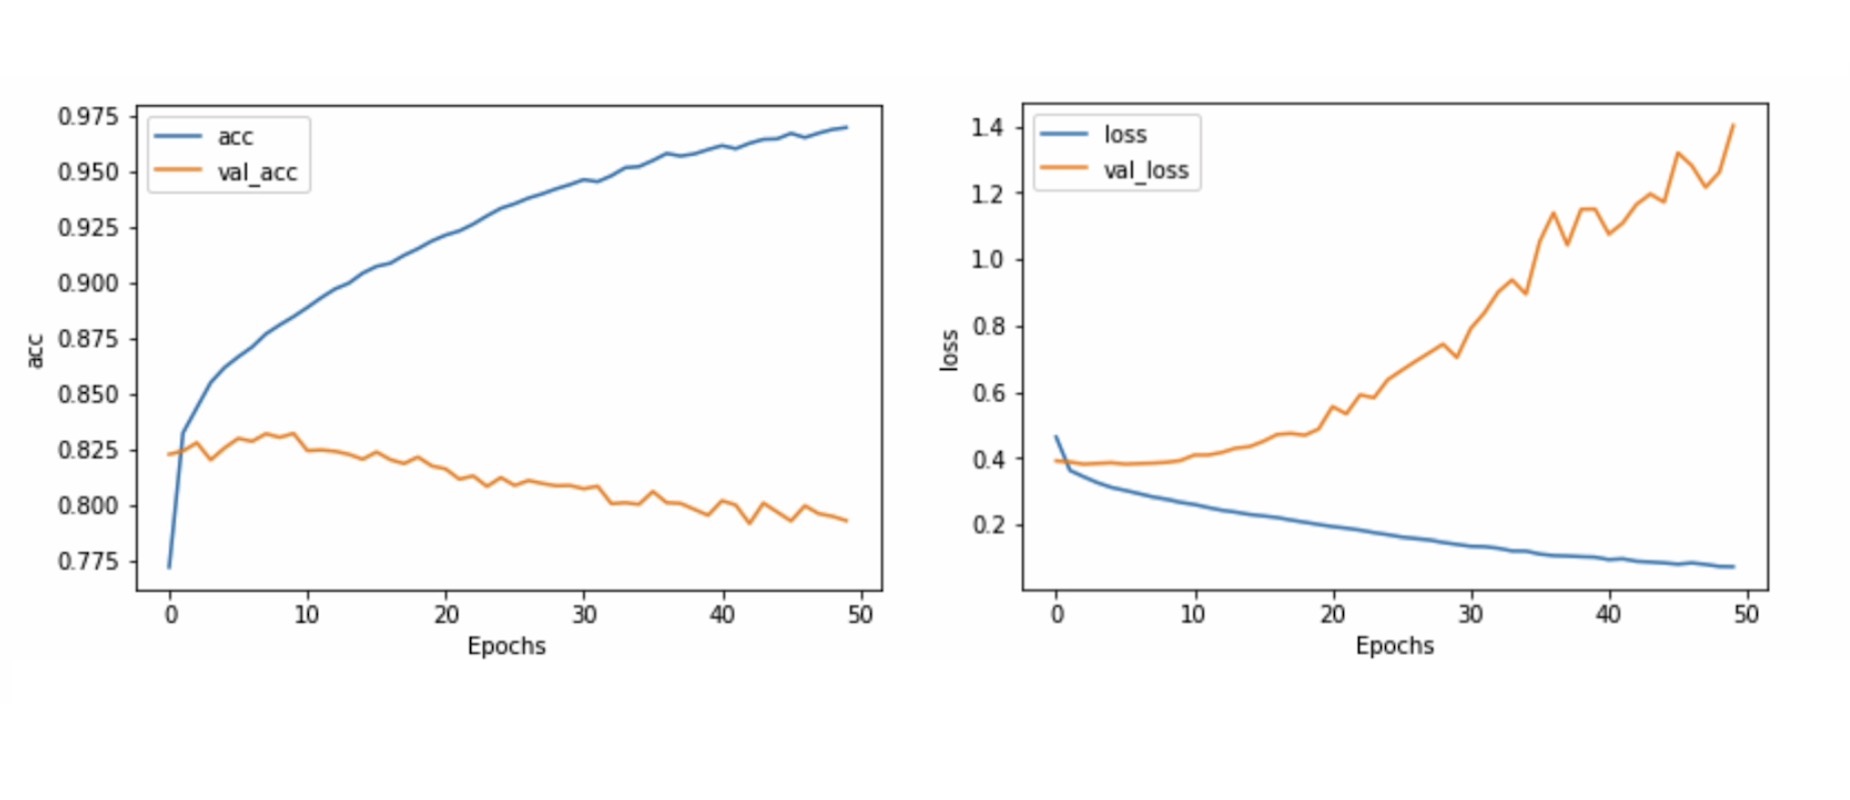
Typical Overfitting Accuracy Graph
In an overfitting accuracy graph:
- Training accuracy continues increasing.
- Training accuracy may approach 100%.
- Validation accuracy stops improving.
- Validation accuracy may eventually decrease.
- The gap between training and validation accuracy becomes larger.
Example:
Training accuracy:   99%
Validation accuracy: 76%
This large difference is a strong sign of overfitting.
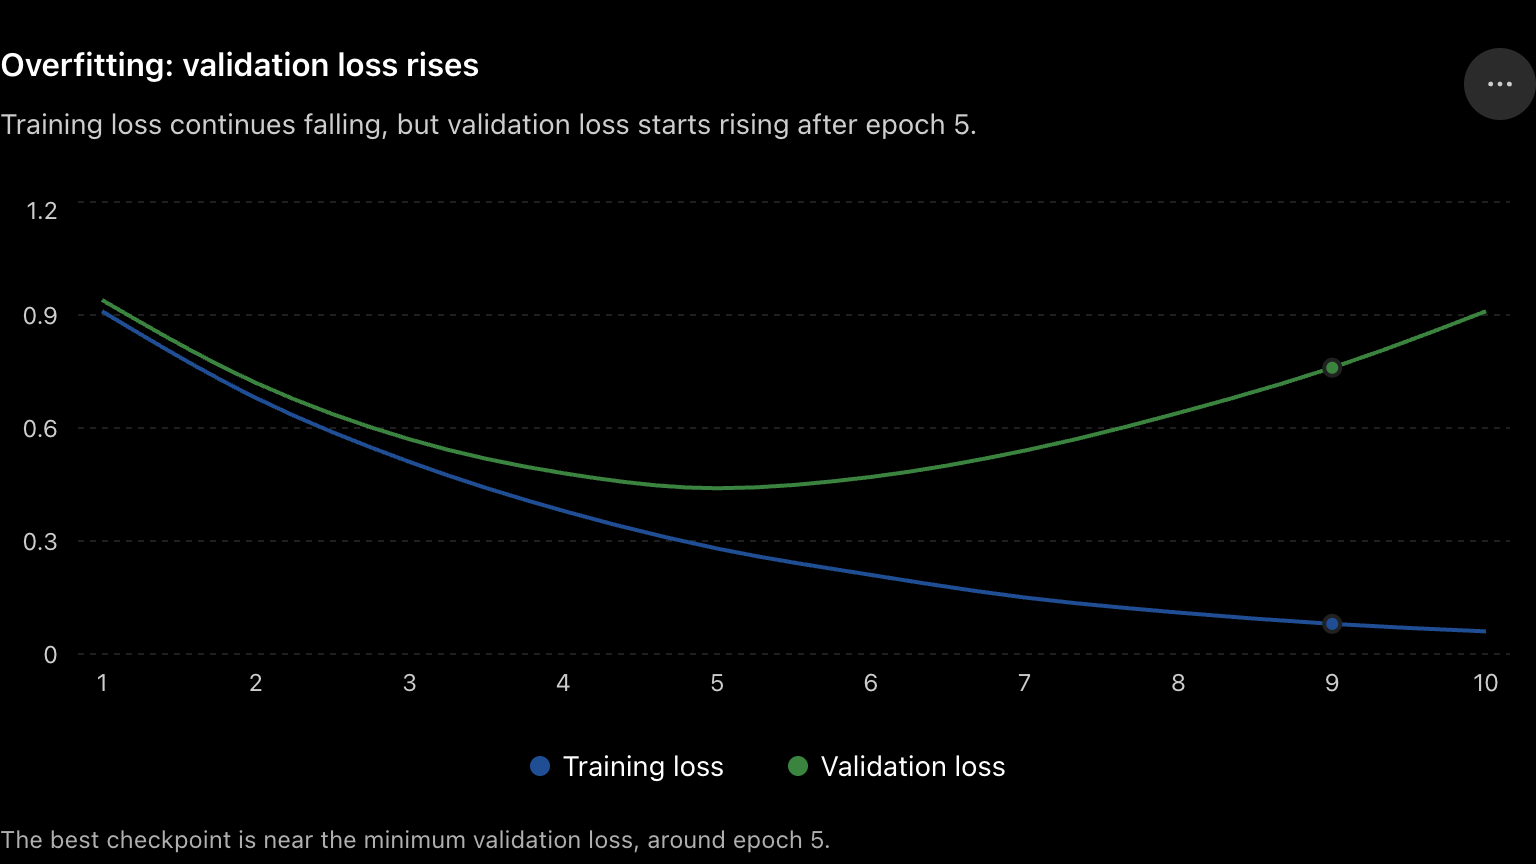
Typical Overfitting Loss Graph
The validation loss graph is often the clearest way to detect overfitting.
The pattern usually looks like this:
- Training loss keeps decreasing.
- Validation loss decreases initially.
- Validation loss reaches its lowest point.
- Validation loss then starts increasing.
The moment validation loss begins increasing while training loss continues decreasing is known as the overfitting point.
Why Validation Loss Can Increase
Validation loss may increase because the model becomes too confident in incorrect predictions.
The validation accuracy may remain unchanged for a few epochs, but the validation loss can still increase.
For example, imagine the correct class is “cat.”
Earlier prediction:
Cat: 0.55
Dog: 0.45
Later incorrect and overconfident prediction:
Cat: 0.05
Dog: 0.95
Both may count as one incorrect prediction, but the second prediction produces a much larger loss because the model is highly confident and wrong.
This is why validation loss is often more sensitive than validation accuracy.
Common Causes of Overfitting
Overfitting may happen because:
- The model is too complex.
- The training dataset is too small.
- The model is trained for too many epochs.
- The data contains noise.
- There is insufficient regularization.
- Training data lacks variety.
- The validation dataset is not representative.
How to Fix Overfitting
Common solutions include:
- Use early stopping.
- Add dropout.
- Apply L1 or L2 regularization.
- Reduce model complexity.
- Add more training data.
- Use data augmentation.
- Improve cross-validation.
- Remove noisy or irrelevant features.
- Use batch normalization where appropriate.
3. What Is Good Fitting?
Good fitting occurs when a model learns meaningful patterns from the training data and performs similarly on unseen validation data.
A well-fitted model generalizes effectively.
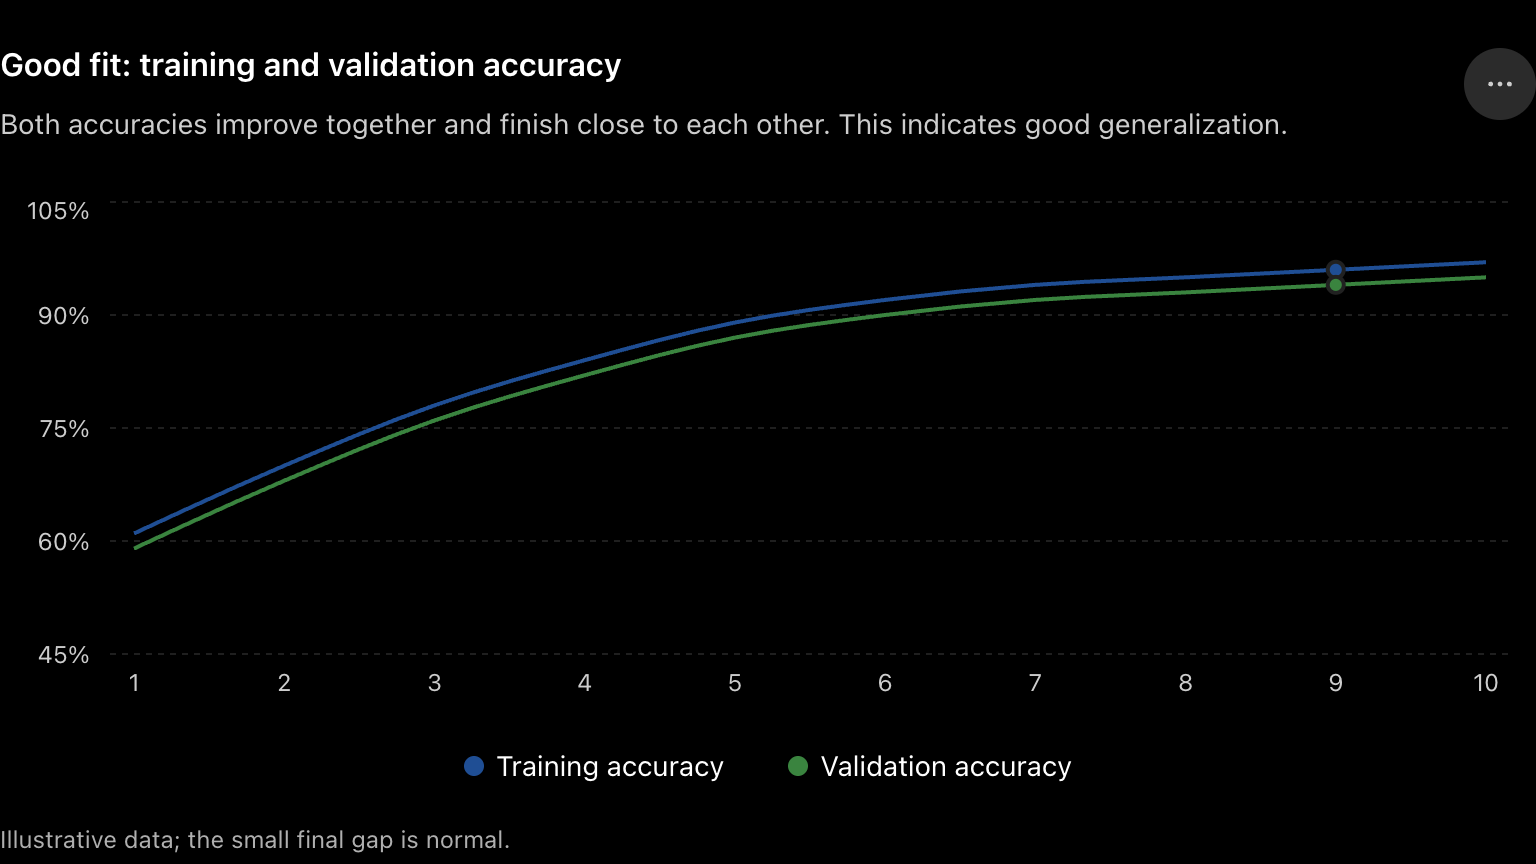
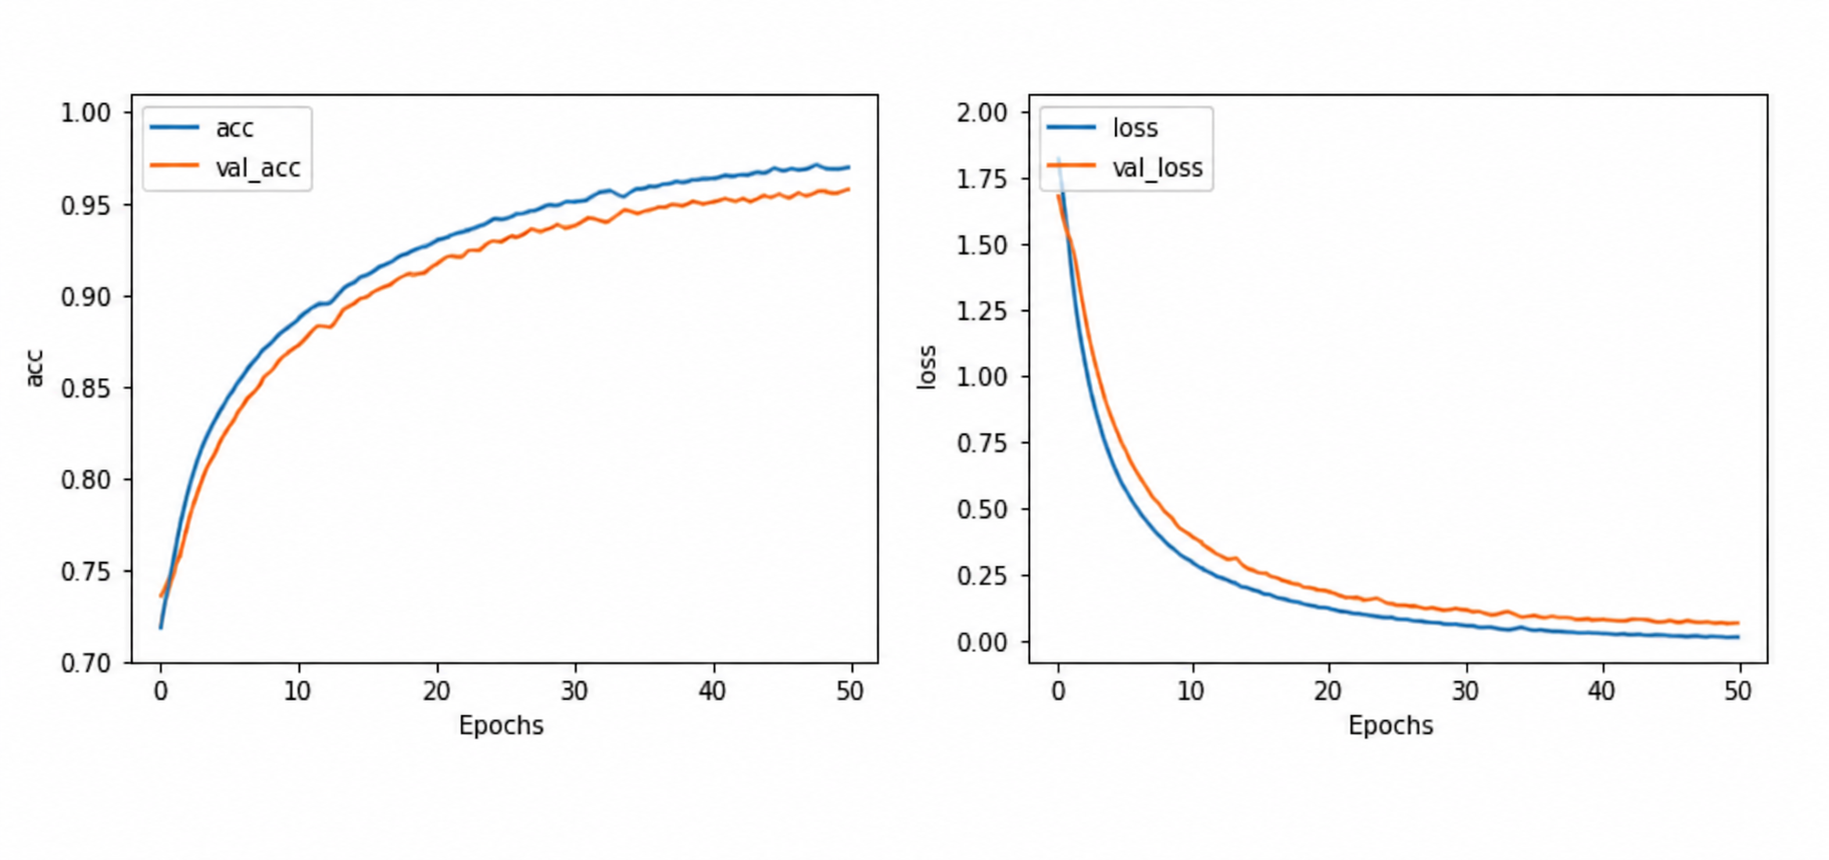
Typical Good-Fit Accuracy Graph
In a good-fit accuracy graph:
- Training accuracy increases steadily.
- Validation accuracy also increases.
- The two curves remain reasonably close.
- Validation accuracy stabilizes without falling significantly.
Example:
Training accuracy:   96%
Validation accuracy: 94%
A small gap is normal because the model has directly learned from the training data but has not seen the validation data.
Typical Good-Fit Loss Graph
In a healthy loss graph:
- Training loss decreases.
- Validation loss also decreases.
- Both curves begin to stabilize.
- Validation loss does not show a sustained increase.
- The gap between the two loss curves remains manageable.
This indicates that the model is learning useful patterns rather than memorizing the dataset.
4. Is a Perfect Model Possible?
People often use the term “perfect fit,” but in practical machine learning, perfection should be treated carefully.
A model showing:
Training accuracy:   100%
Validation accuracy: 100%
Test accuracy:       100%
may genuinely perform perfectly on a very easy dataset.
However, it may also indicate:
- Data leakage
- Duplicate samples
- A validation set taken from the training set
- Incorrect train-validation splitting
- A very small dataset
- An overly easy classification problem
A professional machine learning engineer does not trust perfect accuracy automatically. The data pipeline must first be checked carefully.
The preferred goal is not perfection. The preferred goal is strong and reliable generalization.
5. Training Accuracy vs Validation Accuracy
Training accuracy measures performance on data used to train the model.
Validation accuracy measures performance on separate data used during model development.
Healthy Pattern
Training accuracy:   95%
Validation accuracy: 93%
This usually indicates good generalization.
Possible Underfitting
Training accuracy:   67%
Validation accuracy: 65%
The gap is small, but both values are too low.
Possible Overfitting
Training accuracy:   99%
Validation accuracy: 81%
The model performs much better on training data than validation data.
6. Training Loss vs Validation Loss
Loss measures how wrong the model is.
Accuracy only tells whether the final prediction was correct or incorrect. Loss also considers the confidence of the prediction.
Healthy Loss Pattern
Training loss decreases.
Validation loss decreases.
Both eventually stabilize.
This is usually a good sign.
Overfitting Loss Pattern
Training loss continues decreasing.
Validation loss decreases and then increases.
This is one of the strongest indicators of overfitting.
Underfitting Loss Pattern
Training loss remains high.
Validation loss remains high.
Neither improves sufficiently.
This suggests that the model has not learned the underlying patterns.
7. The Most Important Point on the Graph
The best model is usually not the model from the final epoch.
The best model is often found at the epoch where validation loss reaches its lowest value.
For example:
Epoch 5 validation loss: 0.42
Epoch 6 validation loss: 0.39
Epoch 7 validation loss: 0.37
Epoch 8 validation loss: 0.41
Epoch 9 validation loss: 0.49
The best model checkpoint is likely from epoch 7.
After epoch 7, validation loss increases, indicating the beginning of overfitting.
8. How Early Stopping Prevents Overfitting
Early stopping automatically stops training when validation performance stops improving.
In TensorFlow and Keras:
early_stopping = tf.keras.callbacks.EarlyStopping(
    monitor="val_loss",
    patience=3,
    restore_best_weights=True
)
Then pass it to model.fit():
history = model.fit(
    train_dataset,
    validation_data=validation_dataset,
    epochs=30,
    callbacks=[early_stopping]
)
What These Parameters Mean
monitor="val_loss"
The callback watches validation loss.
patience=3
Training continues for three additional epochs after validation loss stops improving.
restore_best_weights=True
The model returns to the weights from the epoch with the best validation loss.
This prevents the final model from keeping weights from an overfitted epoch.
9. How to Read Accuracy and Loss Graphs Professionally
When viewing a training graph, follow this order.
Step 1: Check Training Loss
Ask:
- Is training loss decreasing?
- Is the model learning from the training data?
- Is the loss stable or oscillating?
If training loss does not decrease, there may be a problem with the learning rate, architecture, labels, data, or optimizer.
Step 2: Check Validation Loss
Ask:
- Is validation loss decreasing?
- Has it reached a minimum?
- Is it starting to increase?
A sustained increase in validation loss usually indicates overfitting.
Step 3: Compare Training and Validation Accuracy
Ask:
- Are both improving?
- Are they close together?
- Is the gap becoming larger?
A widening gap usually indicates poor generalization.
Step 4: Identify the Best Epoch
Find the epoch with:
- Lowest validation loss
- Strong validation accuracy
- Stable training behavior
This is generally the best checkpoint.
Step 5: Evaluate on the Test Set
After selecting the best model using validation data, evaluate it on a separate test set.
The test set should not be used repeatedly during training or model selection.
10. What Is Good Test Accuracy?
There is no universal test accuracy that is always considered good.
A good score depends on:
- Problem difficulty
- Class balance
- Dataset quality
- Business requirements
- Error cost
- Baseline performance
- Human-level performance
- Existing production models
For one dataset, 90% accuracy may be excellent. For another dataset, it may be unacceptable.
Compare Against a Baseline
Suppose a dataset contains:
90% healthy patients
10% unhealthy patients
A model that always predicts “healthy” receives 90% accuracy.
However, it detects none of the unhealthy patients.
Therefore, 90% accuracy is not necessarily good.
A professional evaluation should also include:
- Precision
- Recall
- F1-score
- Confusion matrix
- ROC-AUC
- Precision-recall curve
- Class-wise performance
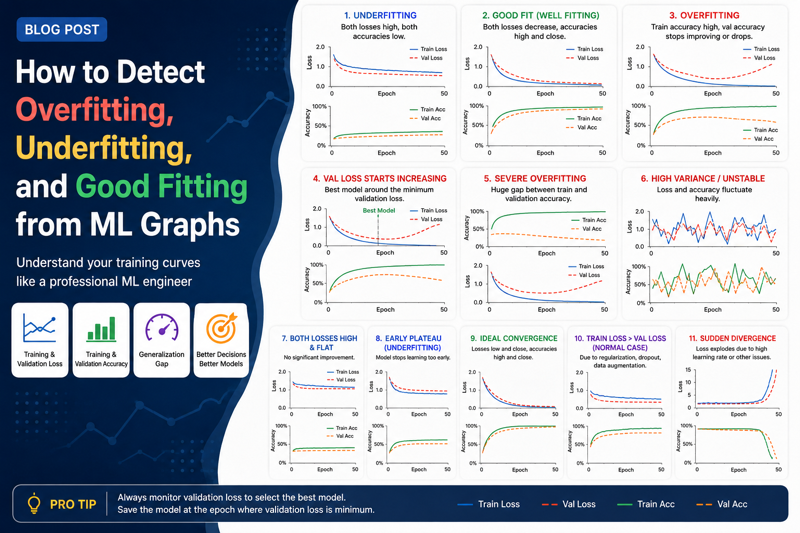
11. Quick Diagnosis Table
| Graph pattern | Image | Likely diagnosis |
|---|---|---|
| Low training and validation accuracy | 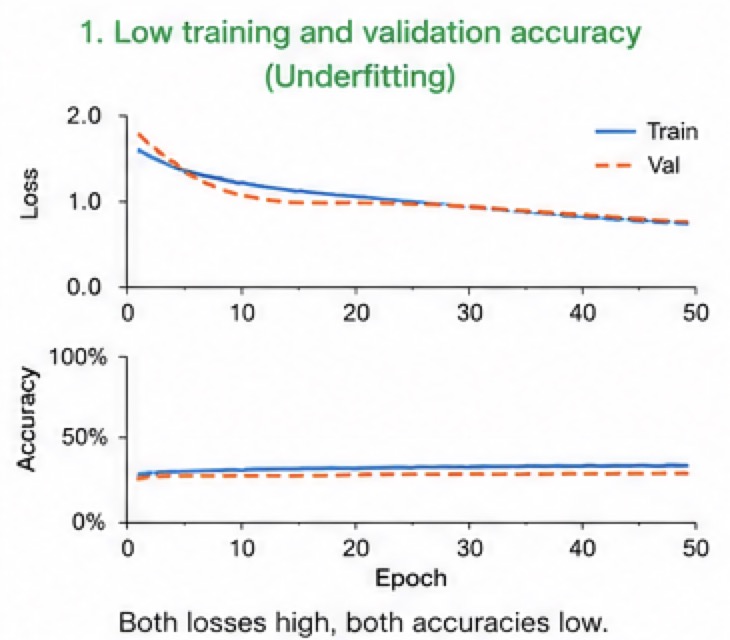 |
Underfitting |
| High training and high validation accuracy | 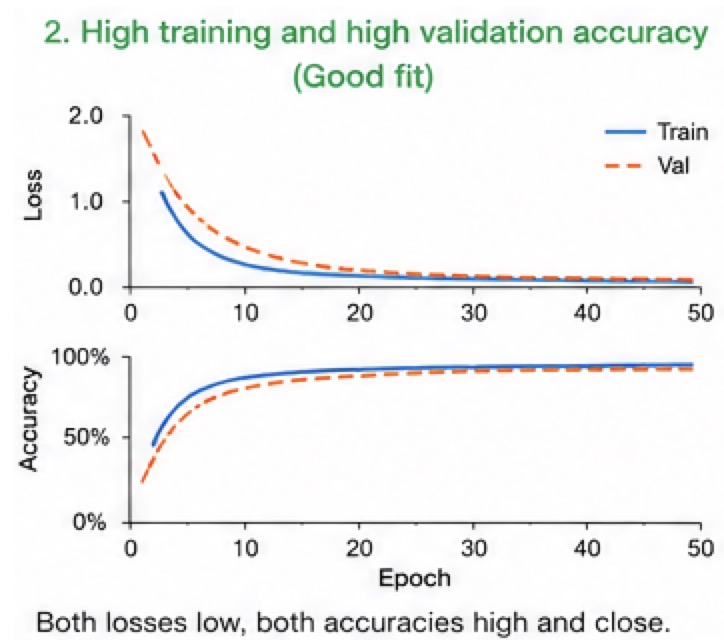 |
Good fit |
| High training and low validation accuracy | 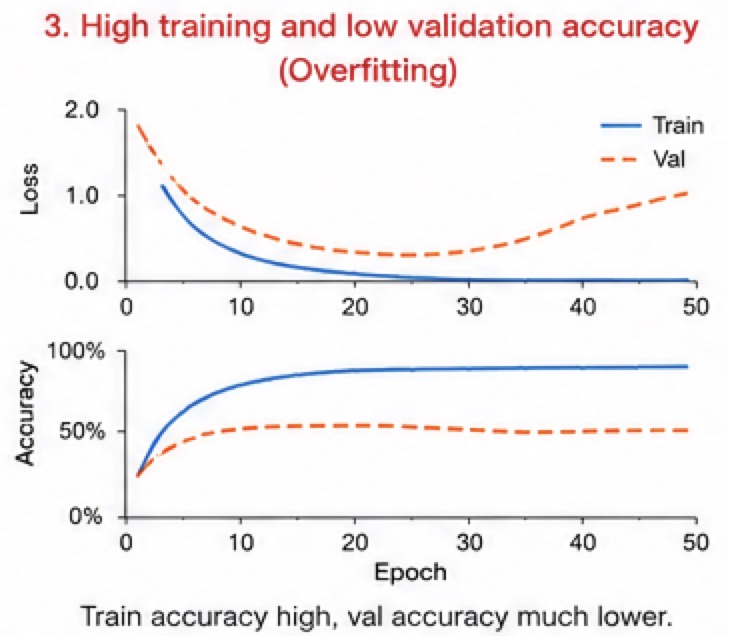 |
Overfitting |
| Training loss and validation loss decrease | 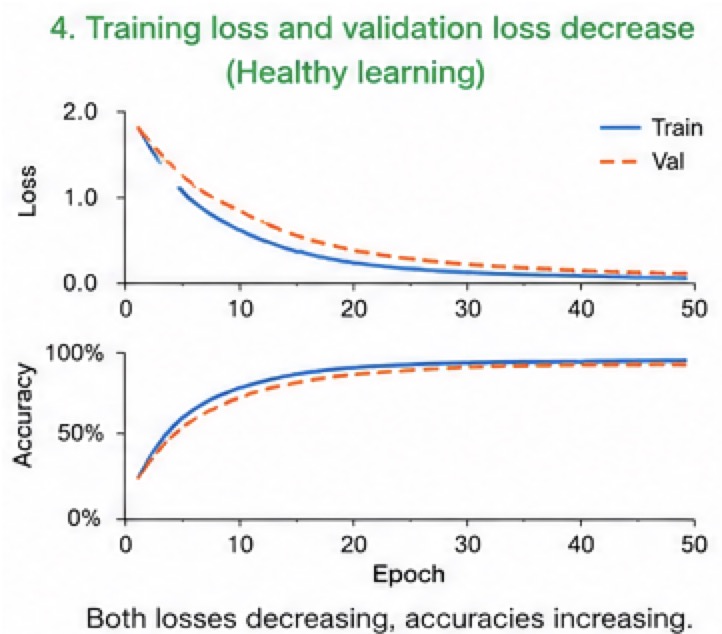 |
Healthy learning |
| Training loss decreases while validation loss increases | 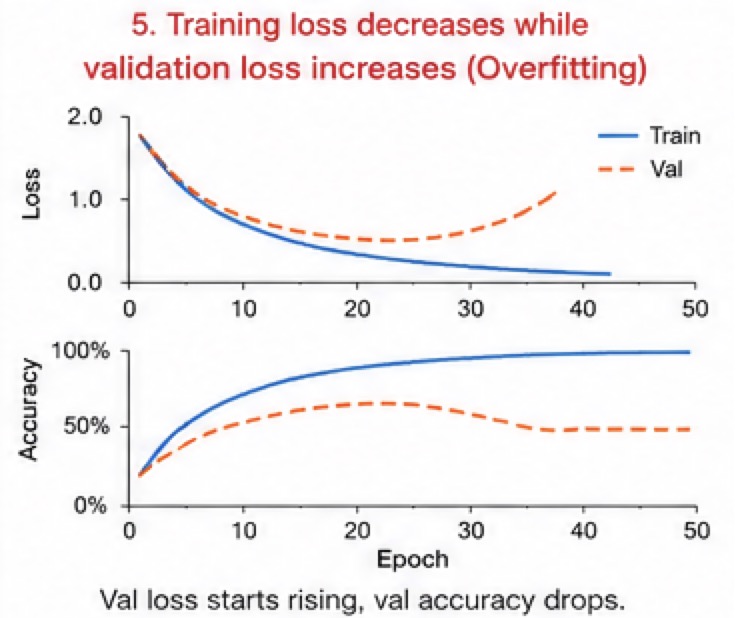 |
Overfitting |
| Both losses remain high | 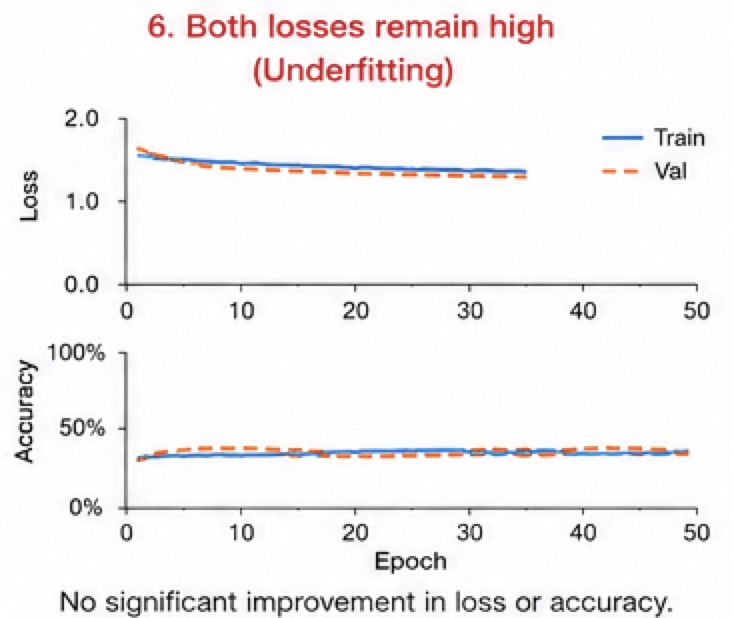 |
Underfitting |
| Validation loss reaches a minimum and rises | 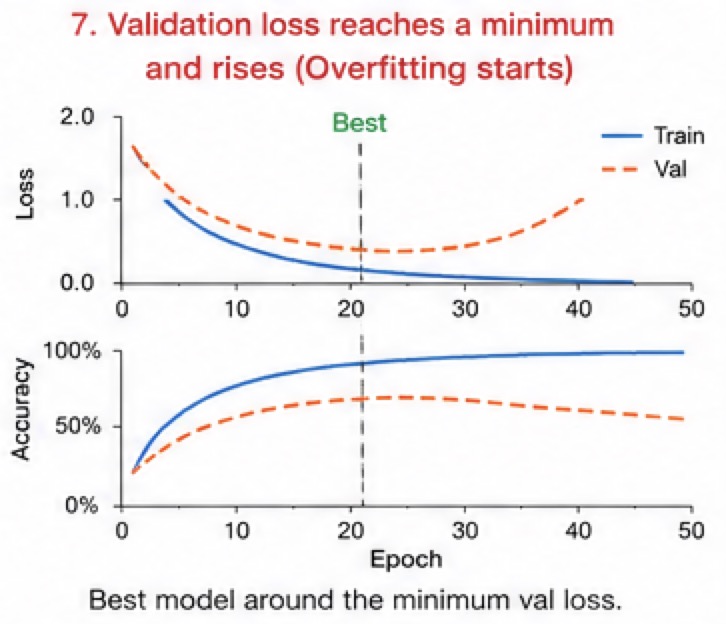 |
Stop near the minimum |
| Accuracy and loss fluctuate heavily | 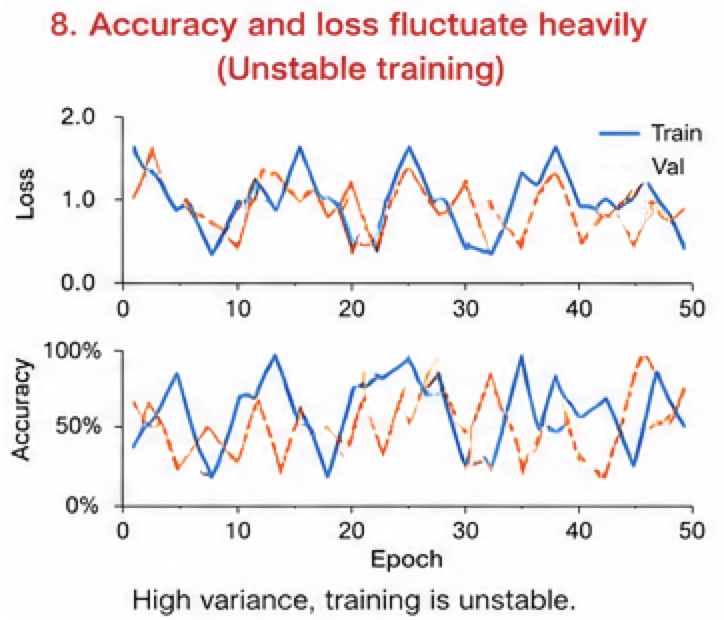 |
Learning rate or unstable training issue |
| Large Gap between Train and Val – High Generalization gap | 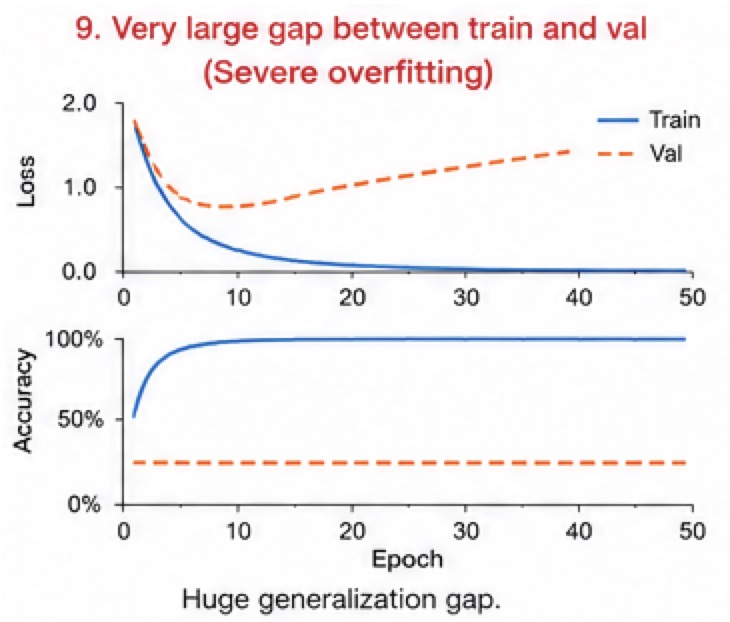 |
Severe Overfitting |
| Underfitting – Model Stops Learning too early | 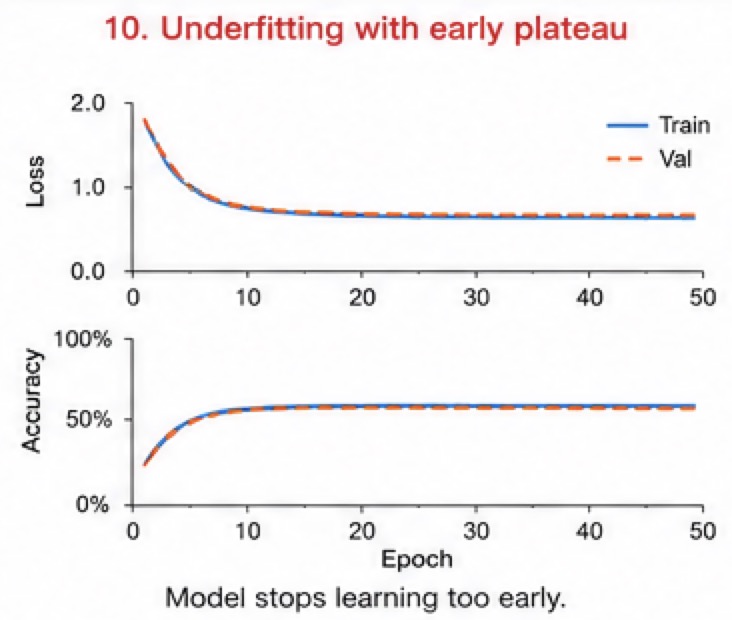 |
Underfitting |
| Losses Low and Close, Accuracy High and Close | 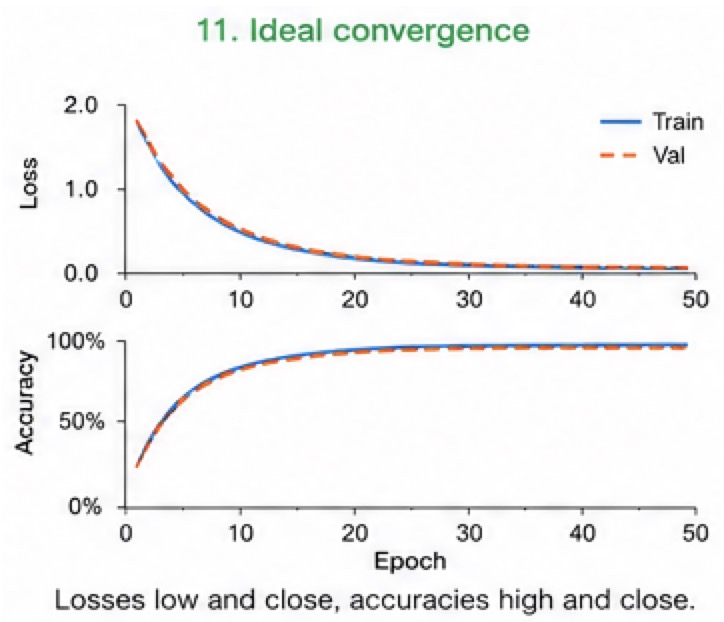 |
Ideal Convergence |
12. Common Misinterpretations
“Training Accuracy Is 99%, So the Model Is Excellent”
Not necessarily.
If validation accuracy is 75%, the model is probably overfitting.
“Training and Validation Accuracy Are Close, So the Model Is Good”
Not always.
If training accuracy is 60% and validation accuracy is 58%, the model is likely underfitting.
“Validation Accuracy Is Stable, So Training Can Continue”
Not necessarily.
Validation loss may already be increasing, indicating that predictions are becoming less reliable.
“The Final Epoch Produces the Best Model”
Often false.
The best checkpoint is commonly found several epochs before training finishes.
Final Conclusion
To identify model fitting correctly, never evaluate accuracy alone.
A good-fitting model usually shows:
- High training accuracy
- High validation accuracy
- A small generalization gap
- Decreasing training loss
- Decreasing or stable validation loss
- Strong performance on an untouched test set
An underfitting model shows poor performance on both training and validation data.
An overfitting model shows excellent training performance but weaker validation and test performance.
The most important visual warning sign is:
Training loss continues decreasing
while
validation loss starts increasing
That pattern usually means the model has started memorizing the training data.
The professional goal is not to build a model that performs perfectly on training data. The goal is to build a model that performs reliably on data it has never seen before.

There are 0 comments